Ontario Economic Report 2017
About the Ontario Chamber of Commerce
For more than a century, the Ontario Chamber of Commerce (OCC) has been the independent, nonpartisan voice of Ontario business. Our mission is to support economic growth in Ontario by defending business priorities at Queen’s Park on behalf of our network’s diverse 60,000 members.
From innovative SMEs to established multi-national corporations and industry associations, the OCC is committed to working with our members to improve business competitiveness across all sectors. We represent local chambers of commerce and boards of trade in over 135 communities across Ontario, steering public policy conversations provincially and within local communities. Through our focused programs and services, we enable companies to grow at home and in export markets.
The OCC provides exclusive support, networking opportunities, and access to innovative insight and analysis for our members. Through our export programs, we have approved over 1,300 applications, and companies have reported results of over $250 million in export sales.
The OCC is Ontario’s business advocate.

ISBN: 978-1-928052-40-1
© 2017. Ontario Chamber of Commerce. All Rights Reserved.
Thank you to our Landmark Partner:

Thank you to our Research Partners:

Thank you to our LeadON Partner:

Thank you to our Event Partner:

Contents

 LETTER FROM THE PRESIDENT & CEO
On behalf of the Ontario Chamber of Commerce (OCC) and Ontario’s Chamber Network, I am pleased to present the inaugural Ontario Economic Report (OER). The OER is a new, annual document aimed at spurring growth and prosperity in Ontario. This report is the result of an ambitious consultation process, LeadON, which engaged stakeholders in a series of discussions on the advocacy goals of the OCC. The OER will allow us, on behalf of Ontario’s business community, to continue to lead, drive and shape the future success of our economy and broader society.
The OER builds on our recent five-year economic agenda for the province, Emerging Stronger, which pursued important public policies in a number of areas critical to Ontario’s success. This document also reflects a conversation that began at the 2016 Ontario Economic Summit (OES), at which workforce development and innovative public sector management practices were identified as the cornerstone of economic recovery and growth. As with OES, the OER will remain at the core of our organization’s advocacy and research efforts in the years to come and will serve as the annual policy platform of the OCC.
Each year, the OER will present the collective voice of our membership. Through the Business Confidence Survey, the Business Prosperity Index, and the Economic Outlook, this report will provide a snapshot of the year that was and the year ahead. Taken together, we hope that these analyzes lead a data-driven conversation on the landscape of Ontario’s economy.
Building on these findings, the report will also present the OCC’s policy vision for the year; a vision that incorporates the perspectives of our members and is responsive to Ontario’s political and policy environments.
In the inaugural OER, our Business Confidence Survey revealed that Ontario businesses continue to be cautiously optimistic about their own organizations’ economic future, but less so about that of the province. This perception is bolstered by the results of the new Business Prosperity Index, which suggest vulnerabilities in the economy. Despite projections that Ontario will lead Canada in economic growth in the coming years, diminished profitability, lower labour market participation, and sluggish market activity, along with other key factors, have resulted in a risk-averse atmosphere in which businesses are disinclined to grow production.
The insights gained from these data have influenced the policy direction of the OCC in 2017. First, we will continue our work on health transformation, which was a major focus of our policy and advocacy efforts in 2016. Our research has shown that strengthening our health care system remains a top priority for our members and the number one issue for Ontarians. This year, we intend to convene a series of conversations of critical importance to the personal and economic health of Ontarians, and continue to champion the message that the public health care system can be an economic driver for the province.
Second, we will examine skills and workforce development. Over the past few years, OCC members have consistently cited an inability to find qualified workers as a top challenge for their business. To remain globally competitive, employers require workers with advanced and highly specialized skillsets. As a convenor of employers, educators and government in over 135 communities across the province, the OCC is uniquely positioned to develop policy options that will ensure that all regions across Ontario have access to the skilled workforce required to compete in a technology-driven knowledge economy.
Third, we will focus on the linked policy priorities of the environment and infrastructure. This year will be a critical year on both fronts, as Ontario embarks on the development of a long-term infrastructure plan and launches a cap and trade program. At the same time, the federal government will continue to move with the implementation of its own infrastructure plans and institutions. If enacted correctly, these initiatives could create new opportunities to strengthen the foundations for long-term, sustainable economic growth and prosperity, — if not, they could instead produce onerous new costs for business and destabilizing debt for the Province.
The Ontario Economic Report marks the beginning of an exciting new chapter for the OCC’s policy and advocacy efforts. I would like to thank all of you who have been involved in our organization’s work in the past. I hope that we can continue to work together to achieve change that will make this province the best place to live, work, and play.
Allan O’Dette

President & CEO
Ontario Chamber of Commerce
What the Leaders are Saying
 |
|
Kathleen Wynne
Premier of Ontario, Leader of the Ontario Liberal Party“I would like to thank the Ontario Chamber of Commerce for the work they do to support Ontario’s businesses. Our economy is growing on the strength of the people and companies who are innovating and creating new jobs in our province. Every day, start-ups are launching, new businesses are growing — and that has a direct impact on people’s lives. When people can get ahead, that helps our economy stay ahead too. Our government is committed to supporting businesses and our communities by making investments that will ensure Ontario continues to remain competitive, create jobs, strengthen the economy and help people in their everyday lives.” |
|
 |
|
Patrick Brown
Leader of the Official Opposition, Leader of the Ontario PC Party“Ontario is privileged to be home to world-class businesses and the hardest working people. Despite this fact, our province — once the economic engine of the country — now lags behind other provinces with an uncompetitive economic climate and unsustainable hydro rates. The Ontario PC Party envisions a future where Ontario leads and shapes our country’s economic future once again. Over the coming years, I look forward to continuing to work closely with the Ontario Chamber of Commerce and Ontario’s business community on our shared vision for a more prosperous province.” |
|
 |
|
Andrea Horwath
Leader of Ontario’s New Democrats“Ontario is a province full of hard-working families, plentiful opportunities, and a dynamic business community. As the first Ontario Economic Report shows, moving Ontario’s economy forward depends on a vision that incorporates economic growth, personal health, environmental stewardship, and infrastructure investment.
Working with experts like the OCC, I know we can build a future for every Ontarian — a future that is safe and secure, a future where innovation is rewarded, where everyone can share in the opportunities we create, across the province. Together, we can build an Ontario that people are proud to call home, where Ontarians can get ahead, plan for their children’s future, and depend on world-class care when they need it.” |
2016 OCC ADVOCACY IMPACT
The OCC, in partnership with its Chamber Network and corporate members, has achieved meaningful policy change on behalf of Ontario’s business community. The following represents a brief snapshot of some of the most significant progress we made in 2016.
|
TOPIC
|
ASK
|
WIN
|
|
Closing Ontario’s Tourism Gap
|
In Closing the Tourism Gap: Creating a Long-Term Advantage for Ontario, the OCC advocated for the development of a government-wide Ontario tourism strategy with measurable targets. We also highlighted the need to work with tourism operators to reduce the regulatory and cost burdens within the industry by adding tourism to the Red Tape Challenge.
|
✓ In Growing Tourism Together the government explicitly acknowledged the efforts and leadership presented by
the Ontario Chamber of Commerce through our solution-based advocacy approach. The report recognizes our efforts stating, “The government is encouraged by the leadership that industry is already taking. Recently, the Ontario Chamber of Commerce released a forward-looking report on how the sector can collaborate to improve avenues for success. The report provides an examination of provincial tourism industry trends and presents recommendations for government and industry to work together to boost long-term competitiveness and generate sustainable demand for Ontario tourism.”
✓ The Ontario government has signalled that it will add the tourism sector to the Red Tape Challenge.
|
|
Increasing the Number of Economic Class Immigrants
|
In Passport to Prosperity: Ontario’s Priorities for Immigration Reform, the OCC urged the federal government to reinstate the economic category immigration target to the 2015 range by no later than 2017/18.
|
✓ In October 2016, Immigration Minister John McCallum announced that the Federal government plans to keep the
immigration targets for 2017 at 300,000. However, the new plan represents a higher target for economic immigrants —
increasing from 160,600 in 2016 to 172,500 in 2017.
|
|
Shaping the Future of Provincial Regulatory Reform
|
Over the course of our five-year Emerging Stronger series and in our annual prebudget submissions, the OCC has regularly called for a reduction in the regulatory burden on Ontario businesses through improvements to, reductions in, and modernization of, provincial regulation.
|
✓ In the Ontario Economic Outlook and Fiscal Review, the government announced a series of steps to address the cumulative burden facing Ontario business:
✓ The Red Tape Challenge, a strategy encouraging Ontarians to submit comments to a Regulatory Modernization Committee regarding regulations that impact them;
✓ A Regulatory Centre of Excellence, which identifies and champions best practices from around the world;
✓ A Government Modernization Fund to address the cost of modernizing outmoded regulatory processes;
✓ A pledge to reduce the time taken to review air and noise approvals by at least 50 percent within the next two years, allaying concerns surrounding environmental compliance; and,
✓ A promise to maintain the industrial exception in the Professional Engineers Act.
|
|
Mitigating the Impact of Retirement Security Reform
|
Recognizing the burden of the proposed Ontario Retirement Pension Plan (ORPP), the OCC called on the government to delay its implementation to provide more time for businesses to adjust to the new financial obligations. All the while, the OCC was working toward our stated, preferred option to support retirement security through a national Canadian Pension Plan (CPP) enhancement instead of a standalone ORPP.
|
✓ In June 2016, after a delay in the roll-out of the program by one year, Finance Minister Charles Sousa announced that the Government of Ontario would be abandoning the ORPP in favour of an enhanced CPP.
|
|
Establishing greater transparency and lower costs in energy pricing
|
The OCC called on the Ontario government, in its July 2015 report Empowering Ontario: Constraining Costs and Staying Competitive in the Electricity Market, to provide greater transparency in energy pricing.
|
✓ The updated Ontario Energy Report, released in March 2016, included an industrial price chart that provides a clearer cost picture for Class A businesses.
✓ In the September 2016 Throne Speech, the government announced that the Industrial Conservation Initiative will be expanded so that any company that consumes more than 1MW will be eligible. Accordingly, an additional 1000 companies in Ontario are now eligible to save between 14% to 30% on their bill, a noticeable increase from the 300 companies currently enrolled in the program.
✓ The removal of the Debt Retirement Charge on commercial, industrial, and other non-residential electricity users on April 1, 2018, nine months earlier than expected.
|
Business Confidence Survey
Organizational Economic Outlook
The OCC regularly surveys its members in order to understand the experience of business in Ontario. This data provides a grassroots look at the economy and can reveal developing trends in economic activity.
As observed in previous research with our membership, there is a considerable confidence gap between our members’ organizational and provincial economic outlooks. This trend continues in 2017. Only 24% of OCC members are confident in Ontario’s economic outlook.

Confidence rating by size of business

This optimism regarding their own organization’s future in 2017 is supported by the significant share of members who expect to maintain or increase their revenue in the next 12 months (79%). Additionally, more than a quarter expect to grow their workforces in that same time. However, among those who are not confident in their organization’s outlook, 45% cited an increase in the price of inputs (such as raw material, electricity, and other business costs) as one of the top reasons for concern.
Organizational Revenue Projection

Percentage that businesses expect their organization’s revenue to increase by in the next 12 months

Worryingly, those members who consider themselves to be well-informed about policies affecting business in Ontario are more likely to predict a decline in their organizational revenue in the next 12 months (23% vs. 16% who do not consider themselves well-informed).
Small businesses are less likely to foresee growth in revenue and workforce. Given that small business make up the majority of enterprise in Ontario, this is a particularly important difference in perception.
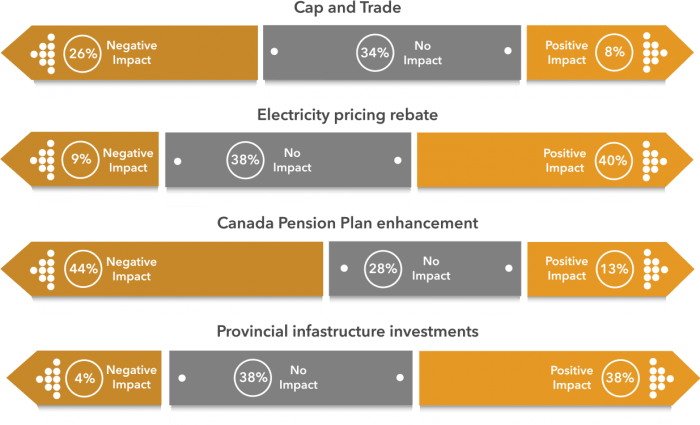
If OCC members are largely optimistic about their own organization’s economic outlook, why are they so pessimistic about that of the province? One reason is direction and governance: only a minority of OCC members believe that a number of major government policies and initiatives will have a positive impact on their organization.
Perceived Policy Impact
Challenges to Growth
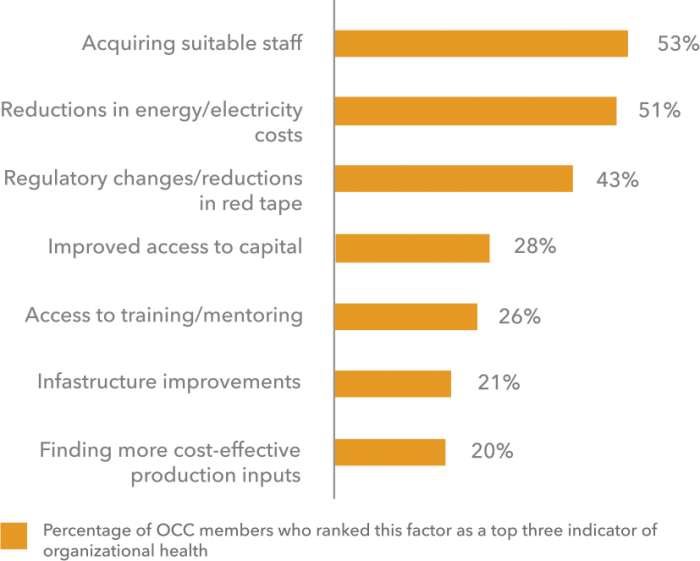
A critical threat facing OCC members is that of staffing, and the difficulty (or even outright inability) of hiring the right people for the right job. Among those who attempted to recruit a new staff member in the past 6 months, only 14% did not encounter any challenges in the process. More than half also reported that the size of their workforce has remained the same for the past six months, and 61% expect to keep the same size of workforce in the next six months. Understandably, 53% of members ranked “acquiring suitable staff” as a top-three influencer of organizational health.
An equally critical threat is the cost of energy. Half of OCC members believe that a reduction in energy/ electricity costs would have an impact on organizational health.
The results of the Business Confidence Survey indicate that Ontario business is in a delicate position: OCC members are unsure of the stability of the wider provincial economy and critical of the impact government policy will have on their organization. A number of day-to-day challenges, particularly hiring and electricity costs, are directly impacting their ability to invest and grow. Without an environment that allows business to act on their organizational confidence, broader confidence in the economy will be slow to arrive.
Business Prosperity Index
The OCC, in partnership with the Canadian Centre for Economic Analysis (CANCEA), is pleased to unveil the Business Prosperity Index (BPI), a measure of business prosperity in Ontario. The BPI looks beyond GDP and instead considers the process of wealth generation from business production and investment activities. As the voice of business in Ontario, the OCC believes that a deeper understanding of business prosperity is critical to understanding the prosperity of Ontario as a whole. This is our first iteration of the BPI. For this version, using the most up-to-date data, we track business prosperity in Ontario from 2000 to 2015. Moving forward, this index will be updated annually.
What is the Business Prosperity Index measuring?
The BPI is designed to be consistent with data used by Statistics Canada to calculate GDP, with the goal of providing a better understanding of business conditions and decisions in Ontario than what is offered by GDP itself.
If economic prosperity is a measure of the amount of resources (financial or otherwise) that someone has available to make economic choices, then business prosperity is a measure of the resources available to a business once their costs and outlays associated with their business are taken into account. The BPI is defined as:

Resources used in the conduct of business includes: cost of goods/services inputs, fixed capital costs and depreciation, taxes on production (after subsidies), wages, costs of financing, transfers to government (such as income taxes), and repayment of debt. Total resources available includes: assets that can be sold, revenue, interest income, new borrowing and equity issuances.
Total resources available includes assets that can be sold, revenue, interest income, new borrowing and equity issuances.
As a measure, the BPI brings together the many facets of business conditions and decision making, such as the use of a business’s assets, debt policies and the role that production of goods and services play in the generation of wealth for businesses.3 The BPI can be broken down into numerous contributions to business wealth and their significance for economic policy. In this regard, the BPI measures trends in the:
- Sources of resources by business and production engagement, whether they be revenues from sales, new borrowing, new equity or liquid investments carried over from previous periods.
- Use of resources by business and production engagement, whether they be costs of production (goods and services), payment of taxes, costs of financing or the repayment of debt;
- Perception of business opportunity and risk which is implied from the way businesses choose to use their resources and maintain certain levels of excess resources (prosperity) on their books.
Generally, businesses with a lower BPI run on finer margins of error, lower liquidity, and are more at risk from adverse changes in business conditions. Yet, this could reflect a business’ appetite for risk to potentially generate future returns and hence greater future prosperity.
Businesses with higher BPI have a significant buffer between their production risks and their ability to respond to changing business conditions. While a high BPI is associated with higher levels of prosperity, it could also be a symptom of fewer opportunities to invest in the business or the rational reaction of business to maintain high levels of flexibility in the face of risky business conditions.
What does the most recent BPI of 48.5% mean?
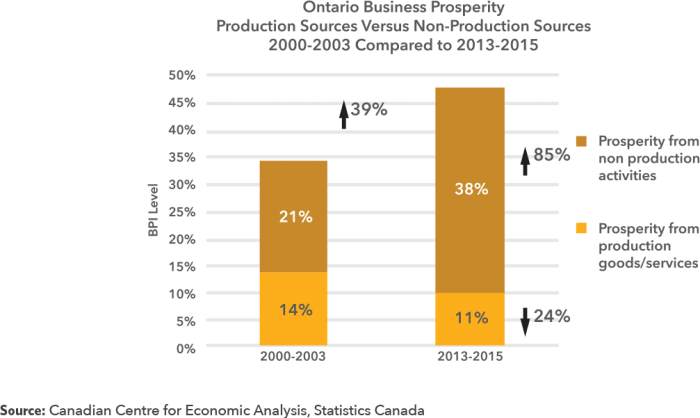
The average BPI for Ontario businesses currently stands at 48.5%, near its 15 year high and almost 40% higher than BPI levels seen at the turn of the century (when the BPI was 34%). This means that, of the total resources available to all businesses in Ontario in 2015, businesses used 51.5% of their resources to conduct their business activities. The other 48.5% of total resources, which is the BPI measure, are in excess of their immediate needs. This can be used for investment in new operating capital, investment in liquid assets, the payment of dividends, or the repurchase of share capital.
From this measure, we can infer that Ontario businesses are relatively prosperous compared to historical levels. On the surface, this is positive, as businesses have more resources available to them to respond to changing business conditions. However, an examination of the trends reveals a more nuanced and troubling story, as the drivers underlying the growth in business prosperity are not necessarily good for the broader health of the Ontario economy.
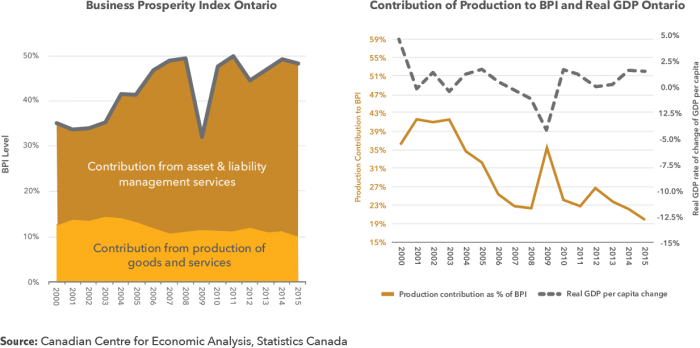
The graph on the left shows the general contributions to the BPI.
Asset and liability management includes debt and equity capital is in excess of repayments of debt, as well as the holding of liquid assets and assets that can be borrowed against, with accompanying asset revaluations being a significant factor.
Production contribution is the net income from over 230 different industries that produce goods and different services.
The graph on the right shows the deterioration of the production of goods and services as a contributor to business prosperity. This is contrasted against the GDP per capita rate of change over the same period, which is a common measure of economic activity.
Note the collapse of BPI production contribution in 2003-2005 which preceded the slower GDP growth rates. Troubling is the continuation of the collapse after the 2008 recession which, if persistent, will continue to underwrite the weaker economic growth that Ontario have been experiencing.
The BPI is currently near its 15-year high. Unfortunately, this is not an indication of production prosperity, but one of a perception of fewer opportunities and higher risk which has led to a preference for the maintenance of operations rather than growth, and the accumulation of financial flexibility.
The prosperity derived from the production of goods and services has declined substantially over the past 15 years.3 The contribution of the production of goods and services to Ontario business prosperity has fallen by 24%, even as the BPI rose by 39% over the same period.
Therefore, the high level of BPI today is not necessarily positive, as it is characterized by a declining contribution from production-related business activity and an increasing contribution from other sources, such as asset revaluations or new share capital and net borrowings. The consequences of such a scenario include:
- B Business prosperity is increasingly becoming more dependent upon financial activities. This is resulting in a deteriorating contribution of non-financial businesses to Ontario GDP.
- Business’ investment motivation to pursue profitability through the production of goods and services is required to compete with higher asset returns elsewhere.
- A hesitation to grow or invest in the face of growing financial resources indicates that Ontario possesses a higher risk operating environment.
To compound these issues, Ontario consumer activity is weak, with household spending having failed to recover from pre-2007 levels and representing only 39% of the strength of the past 15 years. Weak consumer activity directly impacts profitability and the share of business prosperity that stems from goods and services production-generated value. Over the last 15 years, households’ share of GDP rose from 50 to 58 percent, a considerable increase largely fueled by higher household debt levels (which has now emerged as necessary debt repayments that have reduced disposable income). This had resulted in a greater dependency of the market on household spending, and more pain when households pull back. Both consumers and producers have a higher perception of risk in the market, which encourages businesses to keep their assets liquid and flexible, rather than re-invested in productive processes (such as new machinery and equipment, or new labour).
In the following pages, we investigate in more detail the factors driving these trends.
BPI: Auxiliary Indicators

Operating Surplus Index (profitability)
Looking at all non-financial businesses in Ontario, profitability is down significantly in 2015 and now stands at 17.5% of the strength of the past 15 years. For unincorporated businesses, this was the lowest profitability level in 15 years. Competition with imports and higher costs related to production have been a significant factor driving the decline in profitability since 2004, with costs associated with total wages, transportation equipment, energy and mineral fuels, administrative/head office, waste management and remediation services being recent drivers. This decline in profitability has influenced the weakness identified in the BPI in two ways: lower profits from production have been balanced out by an increased emphasis on financial activities; and with the markets not growing as fast as it has previously, this has shrunk the ability of business to make a profit when compared to the size of the domestic consumer base.
Export Performance
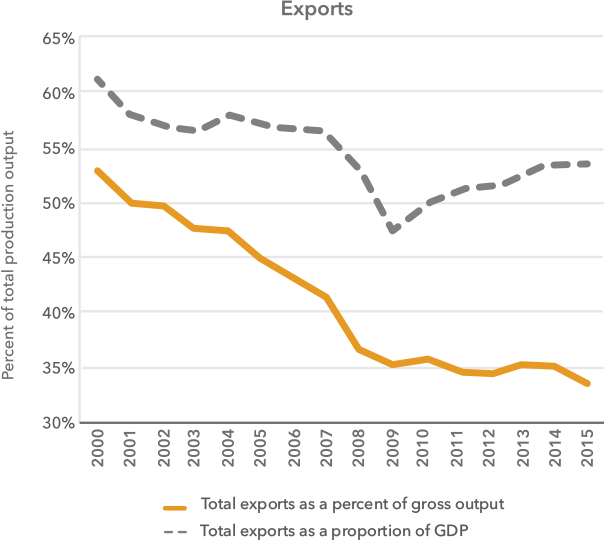
With an increased emphasis on global trade, Ontario exports have been slowlyrecovering to their pre-2007 levels. However,export performance still remains lacklustre,evidenced by the falling trend of exportproduction to gross domestic production.These trends partly reflect a weakened globaleconomy. A weak domestic market and poorexport performance both contribute to anenvironment in which business derives less prosperity from dedicated business activity such as the production of goods and services.
Consumer Activity

Consumer activity across Ontario is currently weak, with household spending having failed to recover from pre-2007 levels and representing only 39% of the strength of the past 15 years. This decline in spending is a result of reduced consumer engagement, a higher perception of risk by households, an aging population that spends less on average, wealth and income inequalities including wages that have not kept pace with economic growth, and Ontario’s relatively high cost of living.
Housing Affordability
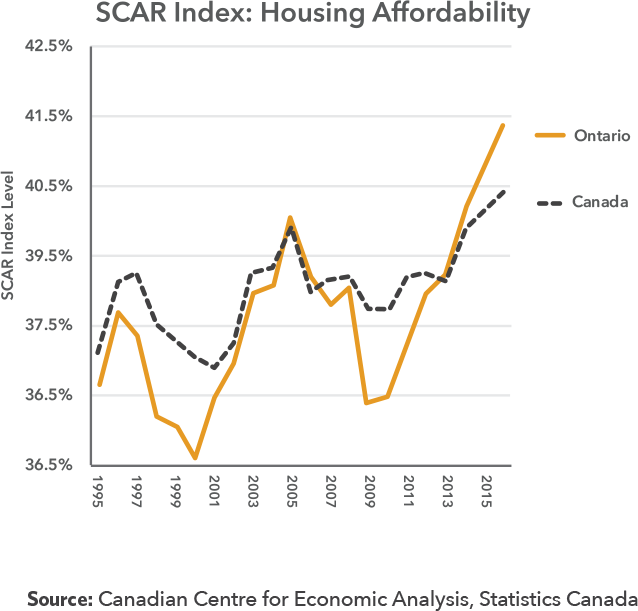
A major component of cost of living is housing affordability. Shelter-related costs have been gradually increasing across Canada, but in Ontario the challenge is even more acute, with CANCEA’s Shelter Consumption Affordability Ratio (SCAR) Index (a full pocketbook measure of housing affordability) rising even more aggressively here than nationwide since 2010. Rising shelter-related costs (including transportation) challenge consumer engagement, impacting market activity, but also contribute negatively to labour market activity, as it becomes increasingly difficult to hire. Both the price and availability of appropriate shelter impact the ability of Ontario business to attract global talent, and reduces our competitiveness.
Labour Market Activity
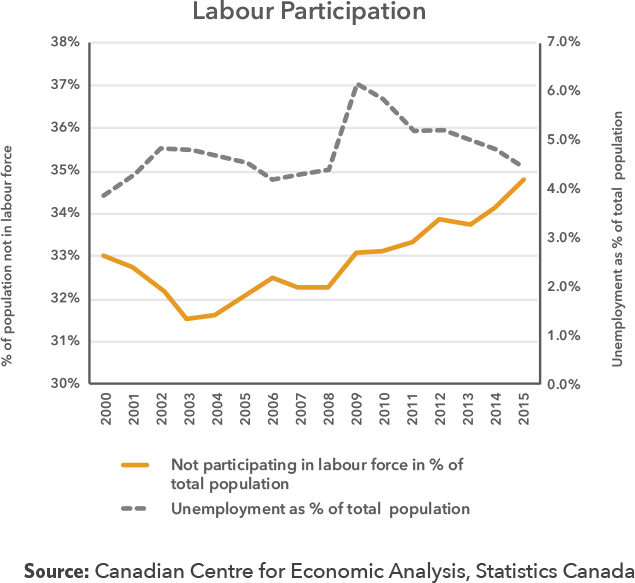
Labour participation in Ontario is been chronically falling since 2003, and the proportion of the population that is not a part of the labour force now sits at 15-year high of 35%. Yet, unemployment as a percent of the total population has been falling. The chronic downward trend of labour participation suggests an increasingly structural scenario, in which there is a declining reliance upon labour and therefore the generation of broadbased wages in the province. This impacts the market in a long-term way: the reduction of disposable income means that consumers have less to spend.
The trends are the result of a number of factors: higher productivity driven by technology, the aging of the population, and wage increases not keeping up with productivity gains. Critically, there is a relationship between the low productionrelated income seen in the BPI and lower labour participation.
Public Capital

Public capital investment as a proportion of private investment and GDP has grown from very low levels of investment in the early 2000’s to a peak of 3.5% of GDP in 2010. Investment is now down 4.6 points since its peak in 2010 and has remained below recent historical levels for the past few years. While governments have made large commitments to infrastructure spending, these investments have yet to be enacted on a large scale. Published CANCEA research suggests Ontario should be infrastructure investing and maintaining at a level equal to 4.5% to 5% of GDP. It currently stands at approximately 3%. The “on the ground” (or “systemic”) effects of public capital investment take time to impact the economy, so enhanced capital investment is needed now to boost business prosperity in the future.
Taxes

Income and production taxes paid by businesses vary considerably with economic conditions and profitability. Generally, however, the past 15 years has seen an improving tax environment for businesses, with corporate and production taxes paid decreasing generally when compared to the total cost of doing business. This has a net positive impact on the prosperity of businesses in Ontario. In 2015, income and production taxes paid as a proportion of business total costs declined.
BPI: Final Remarks
The BPI suggests that total business prosperity in Ontario is near its 15 year high, but business fundamentals are weak. While significant financial resources are available for domestic production, the share of those resources actually going towards the production of goods, services and future knowledge-based industries is deteriorating.
Several of the factors driving these trends include:
- Business profitability is relatively low, exports are lacklustre. While household spending has become an increasing contributor to economic growth, business profitability has not. Ways in which business profitability can compete with other alternate asset returns needs to be contemplated, otherwise a further deterioration in the motivation to ‘produce’ is expected to continue. This in turn affects the ability of business to be globally competitive.
- Consumer activity, costs of living, housing, labour participation are barriers to economic growth. Consumer activity has not recovered since the 2008 recession, placing further pressure on local businesses to ‘produce’ for local consumers. Several factors are at work in the decline of consumer engagement, most notably the increases in cost of living and high household debt levels. They are constraining the choices that households can make, which local businesses depend upon. Furthermore, the high cost of housing is weighing more heavily upon different generations and communities, hampering the labour and class mobility that has been central to growing economic prosperity in the past.
- Public infrastructure investment: While there is a growing recognition of the importance of infrastructure investment, the province is still hindered by historic underinvestment. Understanding what is needed for future economic prosperity and executing long-term infrastructure plans should be policy imperatives.
The interconnected and compounding pressure of these many factors is key to understanding why Ontario business engagement is weak. In the context of market uncertainties, Ontario business prosperity is increasingly dominated by financial activity rather than production. Strategies to address the factors create vulnerabilities with business prosperity are key to restoring investment in the production of goods and services in Ontario, and securing greater long-term prosperity for the province as a whole.
Economic Outlook 2017
Projected Indicators for Ontario Economic Regions 2017
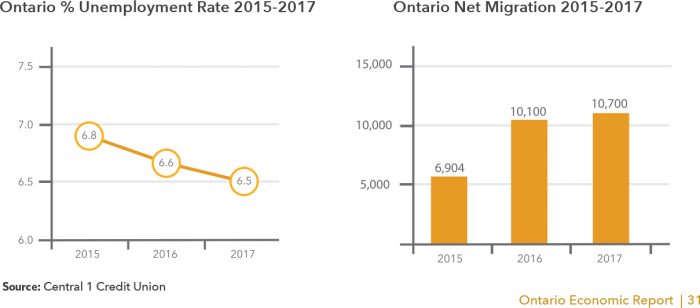
In 2017 Ontario is predicted to continue to see increases in population size, labour force size, and net migration. The unemployment rate is expected to continue its downward trend, dropping -0.1 points over 2016 and -0.3 points over 2015. The labour market participation rate will hold steady at 65%.
Regional Outlook
The regional areas in this report represent Statistics Canada’s 11 Economic Regions (ER) for Ontario. The principal economic indicators used to track regional economic performance are employment,
unemployment, housing sales, housing prices, residential and non-residential building permits, and population.
This year, to reflect the findings that hiring challenges and the skills “mismatch” are top priorities for OCC members, our analysis will focus on the unemployment rate, changes in labour force size and participation, and net migration. Generally, the labour market is a key indicator of regional performance.
Additionally, housing affordability is one of the key indicators impacting the BPI. Its impact on cost of living in Ontario means that it is a data point critical to understanding market activity and the labour market within regions. As such, the median residential price of housing is also included for each ER.
|
Region
|
Unemployment Rate
|
Net Migration
|
Residential Median Price
|
|
1
|
Northwest Ontario
|
7.5%
|
-450
|
$190,000
|
|
2
|
Northeast Ontario
|
6.7%
|
-1100
|
$193,000
|
|
3
|
Ottawa
|
6.0%
|
10,700
|
$333,000
|
|
4
|
Kingston/Pembroke
|
5.7%
|
1700
|
$240,000
|
|
5
|
Muskoka/Kawarthas
|
5.5%
|
4100
|
$295,000
|
|
6
|
Toronto
|
6.8%
|
74,200
|
$580,000
|
|
7
|
Kitchener/Waterloo/Barrie
|
5.6%
|
14,800
|
$375,000
|
|
8
|
Stratford/Bruce Peninsula
|
4.2%
|
800
|
$258,000
|
|
9
|
Hamilton/Niagara Peninsula
|
6.2%
|
14,800
|
$385,000
|
|
10
|
London
|
5.9%
|
5,200
|
$255,000
|
|
11
|
Windsor/Sarnia
|
6.3%
|
1300
|
$185,000
|
Source: Central 1 Credit Union
Note: Please see below to cross-reference with the Ontario Economic Regions map.

Policy Priorities
As we do each year, the Ontario Chamber of Commerce has shaped its 2017 policy direction through consultation with our members, the Chamber Network resolution process, consideration of government priorities and by building on the work of the previous year. However, the narrative defined by the Business Confidence Survey, the Business Prosperity Index, and the Economic Outlook has also influenced our thinking. The analysis performed this year has revealed three critical areas of advocacy for the OCC in 2017, which will represent our central policy programs for the year: Health Transformation, Skills & Workforce Development, and Environment & Infrastructure.
These policy programs, alongside our continued work on energy, regulation, taxation, and other issues important to business, will include deeper, topic-specific analysis of the BPI and regular quantitative check-ins with both OCC members and the general public.
Health Transformation
In Ontario, spending on health care consumes nearly half of the provincial budget; approximately $54 billion in 2016. While government has attempted to reign in this spending with enforced limits on growth, demand for health care is only increasing: an aging population requires more services and in greater numbers, chronic diseases and mental illness are increasingly critical, and patients are interested in accessing the newest medical innovations.
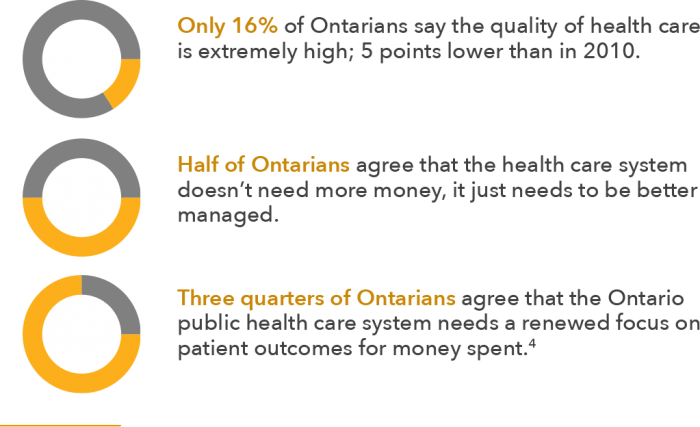
Concern for the sustainability of the public health care system is high among both OCC members and the general public. Only 14% of OCC members are confident in the sustainability of the system, and even the general public is pessimistic: a mere 39% is very confident that the system will be able to fund a consistently high level of care in the future. Even those OCC members who are confident in the province’s economic outlook overall are still more likely to lack confidence in our health care system. Clearly, transformative action must be taken.
CHAMBER NETWORK ACTION
The Ontario Chamber Network has expressed its support for a greater focus on mental health in the workplace, with resolutions on
healthier workplaces and a dedicated Workplace Mental Health Strategy. The Network also passed a resolution directed specifically at Northern and rural health challenges, with special mention of mental health concerns in those regions.
Review the 2016 Health Transformation Initiative at transformhealth.ca
As demonstrated in our 2016 Health Transformation Initiative, the OCC’s approach to health care reform is not merely about addressing the challenge of fiscal sustainability, but about acknowledging that the public system can be an economic driver. Health is a growing sector world-wide, with incredible expansion in both demand and innovation. Ontario, with its world-class talent and top-notch research facilities, sits at the crossroads of this opportunity. Our health care system should be able to tap into that potential to deliver both positive health and fiscal outcomes for all Ontarians.
This year stands to be impactful for health system reform, thanks in part to the negotiation of a new federal Health Accord, the release of the much-anticipated Ontario Supply Chain Review Panel report, and the continued commitment to reform from the Ministry of Health and Long-Term Care. As part of our on-going advocacy, the OCC will build upon the research we conducted in 2016 to address these issues. In addition, we intend to bring together expertise and perspectives from across sectors — business, non-profit, academia, and government — to examine three areas of critical importance to the personal health of Ontarians and the economic health of the province:
- Mental Health: A productivity and workforce perspective (Q2). During Mental Health Week, the OCC will convene experts on the topic of mental health as an economic priority, and how the recognition and successful treatment of mental health issues can improve workforce productivity. Panels and speakers will feature businesses sharing best practices and innovative approaches to mental wellness. This event will be followed with a policy brief, summarizing key insights and outlining a series of recommendations for both government and business.
- Digital Health and Big Data (Q4). The OCC will host experts on the digital health revolution for a major symposium. The discussion will seek to identify how to utilize data-driven techniques in Ontario, and how public-private collaboration can make change a reality. The symposium will be followed with a brief that outlines strategies for better integrating digital health tools and big data analytics into Ontario’s health care system.
- Our Aging Population: The impact on health and labour in Ontario (Q4). The OCC will convene a multi-ministry panel of Deputy Ministers and Assistant Deputy Ministers to discuss how Ontario’s changing demographics are influencing our health care system and our labour market; specifically, how this will change the way the government incentivizes economic activity and manages budgets. Discussion will be coloured by an economic examination of the impact Baby Boomers are having on labour participation and market activity, through the lens of the Business Prosperity Index.
Skills & Workforce Development
Viewing Ontario’s workforce from afar, the story appears to be a positive one: more than 600,000 net new jobs have been created since the depths of the recession, and the government is projecting the creation of an additional 323,000 jobs between 2016 and 2019. Ontario’s unemployment rate of 6.7 per cent is below the national average.5 By 2015, the average employee in Ontario had worked for the same employer for 106.3 months (or nearly 9 years). In addition, the share of part-time employment in all jobs shrank in 2015 as compared to 25 years ago.6
Based on these indicators, it would appear as though the province is supported by a robust workforce and, further, that employees experience more stable employment now than ever before. However, the experience of Ontario business is telling a different story. Sixty-two percent of OCC members have attempted to recruit staff in the last six months but only 14% of those did not experience a challenge in hiring. The top challenge cited (by 60% of members) was finding an individual with the proper qualifications.
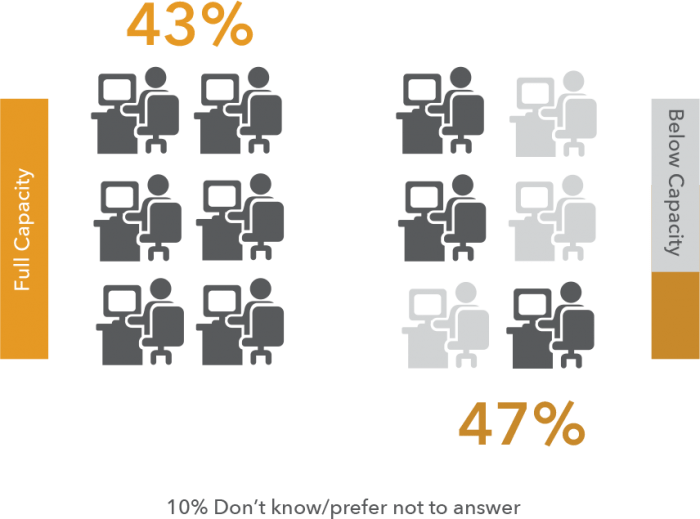
Only 43% of OCC members are currently operating at full capacity; this is higher among large businesses (57%).7
CHAMBER NETWORK ACTION
As Skills & Workforce Development is a top issue for the Ontario Chamber Network, there are currently 16 successful resolutions on its books related to difference facets of this challenge. These resolutions include support for reform of the College of Trades, better integration of immigrants, increased opportunities for experiential learning, workforce development in the agri-food sector, pan-Canadian trade certification, and engaging mature workers.
Similarly, the results of the Business Prosperity Index indicate that weak labour participation is having a direct impact on the ability of firms to generate income from production. Without the right employees, or enough employees, it is difficult for business to increase their prosperity through growth in productiongenerating activities.
This challenge is largely informed by two economic trends. The first is our position in the midst of the fourth industrial revolution, characterized by the emergence of technological breakthroughs in fields such as artificial intelligence, which are disrupting global industry at an unprecedented pace. It is probable that these technologies will dramatically reduce the need for workers in certain sectors, namely those in which workers perform routine tasks that can be easily automated. Even industries not directly affected by innovative technology are seeing major shifts in their workforce thanks to changing labour market demographics and a redefinition of the nature of work. The continued prosperity of the province will be highly dependent on the success of policy measures designed to capitalize on the increased demand for a creative, flexible, highly-skilled workforce.
Second, we are experiencing a significant demographic shift. The share of Ontarians aged 65 and over is projected to more than double from 16 percent of the population in 2015 to 25.3 percent of the population by 2041.8 The effects of an aging population, including lower labour force participation rates and increased demand for social services, will be especially pronounced in regions that do not receive a significant share of immigrants to Ontario. Given that net migration projected to account for 73 percent of all population growth in Ontario from 2015 to 2041, it is critical that governments work to ensure the successful labour market integration of immigrants while continuing to attract highly skilled talent to the province.
Addressing the challenges associated with these trends is evidently a priority for the federal and provincial governments. In late 2016, the federal government amended the Express Entry system to make it easier for international students to secure permanent residency and reduced the importance of obtaining a Labour Market Integration Agreement (LMIA) for high-skilled workers. Similarly, in 2015, the Government of Ontario appointed the Premier’s Highly Skilled Workforce Expert Panel to develop a strategy to help the workforce adapt to the demands of a technologically driven economy.
The OCC occupies a unique position as an intermediary among these groups in over 135 communities across the province. Our policy objective is to ensure that all regions across Ontario have access to the skilled workforce required to compete in the global economy. This objective will be realized through the following initiatives:
- Mapping the Mismatch: An employer/productivity perspective on the skills “mismatch” throughout Ontario (Q2). At a forum in Spring 2017, the OCC will convene business leaders, educators and government stakeholders for a conversation on critical issues impacting workforce development in Ontario, including youth, underutilized groups and renewing the skilled trades. A report outlining key findings and recommendations will follow, supported by economic analysis from the Business Prosperity Index.
- Capitalizing on Disruptive Change in the Workforce (Q3). The advent of new technologies is associated with new products, new markets and new professional opportunities. This report will address the impact of disruptive technologies on the labour market, as well as their broader socioeconomic consequences. The research will focus on the integration of advanced technologies and new business models into the economy as industry and individuals adjust to the fourth industrial revolution. In addition, the research will identify opportunities to leverage technology to innovate, improving productivity and raising standards of living. A launch event for the report will follow.
- Our Aging Population: The impact on health and labour in Ontario (Q4). In a crossover event with our Health Transformation Policy Program, the OCC will convene a multi-ministry panel of Deputy Ministers and Assistant Deputy Ministers to discuss how Ontario’s changing demographics are influencing our health care system and our labour market; specifically, how this will change the way the government incentivizes economic activity and manages budgets. Discussion will be coloured by an economic examination of the impact Baby Boomers are having on labour participation and market activity, through the lens of the Business Prosperity Index.
Throughout the development of these initiatives, the OCC will co-ordinate between governments, education institutions and employers throughout the province to highlight the importance of talent attraction and retention in relation to local prosperity.
Environment and Infrastructure
Infrastructure forms the backbone of our economy and society. It connects the province’s people and businesses, powers our homes and industry, and facilitates our access to the world. It directly contributes to the productivity of our workforce.10 Broadly, it makes our standard of living possible. As infrastructure ages and the demands of our population evolve, continual investments to renew and expand infrastructure are essential to sustaining economic growth in Ontario: $1 billion in new investment generates and supports $16.3 billion in GDP and creates an additional 85,000 job years over the long term.11 Underinvestment in infrastructure has a real cost to Ontarians, estimated at $425,000 for an individual entering the labour force today until they retire.12
|
$160 BILLION
|
Government of Ontario infrastructure investment over 12 years13
|
|
$186 BILLION
|
Government of Canada infrastructure investment over 11 years14
|
|
$425,000
|
Cost to individual due to public infrastructure underinvestment over lifetime of work
|
After decades of underinvestment, governments in Ontario and Canada are making large-scale investments to update and expand our infrastructure stock. The Government of Ontario currently has a plan to invest $160 billion over 12 years, beginning in 2014-15. At the same time, the Government of Canada intends to invest over $180 billion in Canadian infrastructure projects during the next eleven years. In both cases, investments are being made across a range of different areas, including education, transit and transportation, buildings, and trade. These investments should reverse a trend of declining public capital investment relative to GDP, as measured in the BPI. In 2017, these plans will continue to be clarified and refined through, for example, an Ontario Long-Term Infrastructure Plan and a Canada Infrastructure Bank.
Alongside these commitments, the federal and provincial governments will continue to move ahead with their plans to incentivize a transition to a low-carbon economy. This year, for example, Ontario instituted a price on carbon emissions via a cap and trade system. How infrastructure investments are made over the next decade will be an important determinant of our ability to meet climate change objectives. If targeted effectively, these investments have the potential to drive significant emissions reductions and minimize the direct cost to Ontario businesses and consumers.
CHAMBER NETWORK ACTION
Over the past three years, the Ontario Chamber Network has passed nearly 20 resolutions related to environment and infrastructure priorities in the province. These range from the need to invest in trade enabling infrastructure corridors, increase broadband access, expand natural gas service, develop a provincial transportation and transit infrastructure plan, and mitigate the risks of the cap and trade system for business.
From the perspective of the OCC, these initiatives present the province with a critical opportunity to set the foundations for long-term, sustainable economic growth and prosperity. To accomplish this objective, it is essential that we invest in the right projects and manage them effectively. If not, these investments could instead produce new up-front costs for Ontarians and destabilizing debt for the Province. Over the past few years, the OCC’s members have passed several resolutions in support of specific projects to boost economic activity in the province, as well as the need for long-term, integrated transit and transportation strategies In the 2017 Environment & Infrastructure Policy Program, the OCC will seek to inform infrastructure planning and development priorities in Ontario to maximize the economic potential of public investments, while achieving our environmental objectives. We will convene diverse groups of stakeholders to host relevant and timely conversations, leading to clear and substantive priorities for Ontario’s business community. We will also continue to educate and advocate on behalf of businesses as they adjust to operating within a cap and trade system. This will be completed under the banner of two key initiatives:
- Towards Ontario’s Long-Term Infrastructure Plan (Q2+3): The OCC will hold an event that identifies key priorities for the Long-Term Infrastructure Plan (LTIP), expected to be delivered by the province by the end of 2017. The discussion, in particular, will focus on how the province can create an evidence-based planning process. The conversations at the event will help guide a major report on infrastructure later in the year, with key findings and recommendations supported by economic analysis from the BPI.
- Linking Cap and Trade Systems (Q4): The OCC will bring together Ontario businesses, government representatives, and market stakeholders to provide an update on the state of the cap and trade system. The conversation will focus on key questions facing business and provide critical information as Ontario moves to link the system with California and Quebec in 2018. A report that provides outcomes and key learnings from the event will follow.
In undertaking these initiatives, our policy objective will be to ensure that governments’ initiatives lay the foundations for the province’s future economic prosperity.
ONTARIO’S ENERGY CHALLENGE
One of the most critical issues facing Ontario is the cost of electricity. In addition to our formal policy programs, the OCC will continue our advocacy on the energy file in order to affect real change for business.
Energy is top of mind for all Ontarians, as the province’s future economic prosperity is intrinsically tied to the reliability and cost effectiveness of our energy supply. The Ontario Chamber Network and its members have consistently reported that the price of electricity is undermining business’ capacity to grow, hire new workers, and ultimately remain competitive. As evidenced by the Business Confidence Survey, 22 percent of OCC members believe that a reduction in energy/electricity costs would have the greatest impact on their organization’s health and growth, while a further 51 percent of businesses ranked it among their top three policy concerns.
CHAMBER NETWORK ACTION
Electricity and energy strategy is top-ofmind for the Ontario Chamber Network. In the past three years, the Network has passed a series of resolutions related to energy affordability, with an emphasis on business competitiveness, spurring innovation, and as a tool for growth. These included calls to demystify electricity cost drivers, “bend” the cost curve, and better manage surplus energy.
As a starting point for our advocacy on this file in the coming year, the OCC submitted our recommendations for the 2017 Long-Term Energy Plan (LTEP). Within the submission, we called on government to ensure that future energy policies reflect the principles of affordability, transparency and flexibility. We argued that a thoughtful balancing of these principles would promote economic prosperity, business competitiveness and strengthen ratepayer confidence in Ontario. One of the submission’s top recommendations included a call for the adoption of a capacity market system which, if implemented, would provide a costeffective solution for future energy procurement in Ontario.
We will continue our focused efforts to ensure electricity pricing in Ontario becomes predictable, stable and transparent so that ratepayers and industry can adequately understand and plan their energy expenditure. The OCC will accomplish this through two policy activities:
- Electricity Pricing Roundtable (Q2): Building on the themes within the 2017 Long-Term Energy Plan submission, we will convene a roundtable of key industry and government stakeholders to discuss and advocate for policy recommendations that help provide greater planning flexibility, reliability and costeffectiveness for Ontario businesses.
- Empowering Ontario II (Q3): This document will provide an update to our successful 2015 report, Empowering Ontario. It will reflect on a changing energy system and present new ideas to strengthen our competitive advantage by addressing this rising cost to doing business.
The status quo on the energy file is no longer an option and “energy poverty” in Ontario is now a reality. We look forward to working with government to implement energy solutions that support Ontario’s economy.
Looking Forward
Together, the Ontario Chamber of Commerce and the Chamber Network continue to shape the business policy landscape in Ontario. Governments at all levels have responded to our requests for business-friendly changes, including implementing a new means of cutting red tape, improving access to overseas talent, refocusing on a strategy for the tourism sector, and abandoning the ORPP.
Despite these individual successes, the results of the Business Confidence Survey, the Business Prosperity Index, and the Economic Outlook reveal broader challenges for Ontario’s economic health. Ontario is struggling to transition to a disruptive, high-skilled economy. Total business prosperity has increased over time, but less of this prosperity is a result of primary businesses activities. This is indicative of a higher-risk operating environment in which costs associated with production inputs, regulation, and housing have resulted in weak market and labour force activity. For years, the voice of Ontario business has cautioned that regulatory burdens, high input costs, and government policies not supportive of innovation are creating an environment in which businesses struggle to grow. The results of the Business Prosperity Index have given quantitative underpinnings to these concerns, and make clear the urgency of reform.
Throughout 2017 and beyond, business and government must continue to work together to build an environment that supports economic growth and prosperity. The Ontario Economic Report refocuses the OCC’s policy efforts toward achieving this objective. This year’s policy programs—health, workforce development, and environment and infrastructure—will address some of the critical factors that influence business prosperity in the province, as identified by our research. Together with individual policy resolutions developed by the Chamber Network and the discussions facilitated at the 2017 Ontario Economic Summit, we will continue to drive change at the provincial and federal levels.
The Ontario Economic Report will be accessible all year through the offices of chambers of commerce and boards of trade across Ontario. The data contained within these pages can act as a reference, a benchmark, and a catalyst for policy change. We encourage you to leverage the data contained in the report as we work together to achieve a more prosperous Ontario.
the ontario economic report rollout event series
The OCC will share the findings of the Ontario Economic Report 2017, through a series of rollout events in collaboration with our Chamber Network, with communities across the province in an effort to broaden the dialogue on economic prosperity and development.


Facebook: ontchamberofcommerce
Twitter: @OntarioCofC
LinkedIn: company/ontario-chamber-of-commerce
Web:www.occ.ca
References
- Survey of n=773 OCC members conducted online by Fresh Intelligence between October 25th 2016 and November 30th 2016.
- There are 235 industry categories that make up the production of goods and services.
- While Ontario enjoyed an average 2.6 percent real GDP growth rate between the years 2000 and 2007, the source of wealth generated domestically from production activities actually declined by 12 per cent. Since the recovery from the “great recession”, average real GDP growth has been 2.2 percent while wealth generated domestically from production activities fell a further 12 percent over the period.
- Survey of n=1004 Ontarians conducted by The Gandalf Group between December 28th, 2016 and January 3rd 2017. A random
probability sample of this size has a margin of error of +/- 3.1%, 19 times out of 20.
- Ministry of Finance. 2016 Ontario Budget. Government of Ontario. 2016.
- Keep Ontario Working Coalition with Phillip Cross. 2016. Reform That Works: A Call for Evidence-Based Workplace Law Modernization in Ontario. http://www.occ.ca/wp-content/uploads/2013/05/Keep-Ontario-Working-Changing-Workplaces-
Submission-Oct-13.pdf.
- Survey of n=1004 Ontarians conducted by The Gandalf Group between December 28th, 2016 and January 3rd 2017. A random probability sample of this size has a margin of error of +/- 3.1%, 19 times out of 20.
- Ministry of Finance. Ontario Population Projections Update, 2015 — 2041. http://www.fin.gov.on.ca/en/economy/demographics/
projections/.
- Business Council of Canada. http://thebusinesscouncil.ca/wp-content/uploads/2013/03/CCC E-Symposium-Rick-Miner-deck.pdf.
- Institute for Competitiveness & Prosperity. 2015. Better Foundations: The Returns on Infrastructure Investment in Ontario. http://
www.competeprosper.ca/work/working_papers/working_paper_22
- 11 CANC EA. 2015. Investing in Ontario’s Public Infrastructure: A Prosperity at Risk Perspective. http://www.cancea.ca/?q=node/82
- CANC EA. 2011. Public Infrastructure Investment in Ontario: The Importance of Staying the Course. http://www.cancea.ca/?q=node/31
- Government of Ontario. 2016. 2016 Ontario Budget: Jobs for Today and Tomorrow. http://www.fin.gov.on.ca/en/budget/ontariobudgets/2016/
- Government of Canada. 2016. Fall Economic Statement 2016: A Plan for Middle Class Progress. http://www.budget.gc.ca/feseea/2016/docs/statement-enonce/toc-tdm-en.html




 LETTER FROM THE PRESIDENT & CEO


