
This morning, Statistics Canada published its data for the April, 2020 Labour Force Survey. The national picture, unsurprisingly, is not good. Following a drop of over one million in March, employment fell by nearly two million in April, bringing the total employment decline since the beginning of the COVID-19 economic shutdown to over three million. The size of the decline since Feburary (-15.7%) far exceeds declines observed in previous labour market downturns. For example, the 1981-1982 recession resulted in a total employment decline of 612,000 (-5.4%) over approximately 17 months.
The employment situation in the St. Catharines-Niagara CMA is poor, but so far, declines are less than in the country as a whole. The unemployment rate locally is 9.9%, up from 5.5% in February, whereas the national rate is 13%, up from 5.6% over the same period. Labour participation (the percentage of the population either working or seeking work) is down from 59.6% in February to 56.4% in March locally, while the national rate declined from 65.5% to 59.8%. Niagara’s participation rate is generally lower owing to several factors, including an older-than-average population with a greater number of retirees, and a large student body attending post-secondary institutions, some of whom are not seeking work (it is also worth noting that students seeking work are not counted in the unemployment figures).
However, it should be noted that Niagara’s rate is based on a three-month average, which means data from February and March are “pulling down” the official unemployment rate, whereas national and provincial data is not. Niagara’s true unemployment rate is likely much higher.
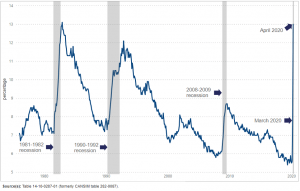
Unemployment rate increases during economic downturns, 1976-2020
The unemployment rate rose 5.2 percentage points in April to 13.0%. This followed an increase of 2.2 percentage points in March. Over the period since comparable data became available in 1976, the April unemployment rate was second only to the 13.1% observed in December 1982. The April unemployment rate would be 17.8% if adjusted to reflect those who were not counted as unemployed for reasons specific to the COVID-19 economic shutdown. During the week of April 12, 1.1 million people were not in the labour force but had worked since February and wanted to work. They were not counted as unemployed, but were counted as not in the labour force because they did not look for work, presumably due to ongoing business closures and very limited opportunities to find new work.
In April, more than one-third (36.7%) of the potential labour force did not work or worked less than half of their usual hours, illustrating the continuing impact of the COVID-19 economic shutdown on the labour market. The “recent labour underutilization rate” combines those who were unemployed; those who were not in the labour force, who wanted a job, but did not look for one; and those who were employed but worked less than half of their usual hours. In comparison, this rate was 11.3% in February.
In March, almost all employment losses were observed in the services-producing sector. In April, by contrast, employment losses were proportionally larger in goods (-15.8%) than in services (-9.6%). Losses in the goods-producing sector were led by construction (-21.1%) and manufacturing (-15.7%). Within the services sector, employment losses continued in several industries, led by wholesale and retail trade (-14.0%) and accommodation and food services (-34.3%). Industries which continued to be relatively less affected by the COVID-19 economic shutdown included utilities; public administration; and finance, insurance and real estate.
Larger firms and institutions seem to have been more able than smaller businesses to retain employees on payroll, likely due to their capacity to put measures in place to adjust to the COVID-19 economic shutdown. This pattern was observed across industries, including wholesale and retail trade; construction; manufacturing; and transportation and warehousing. Overall, employment in firms of 100 employees or more declined by 12.6% (not adjusted for seasonality) from February to April. Employment in firms of between 20 and 99 employees declined by 25.1%, while in the smallest firms (less than 20 employees), it declined by 30.8%.
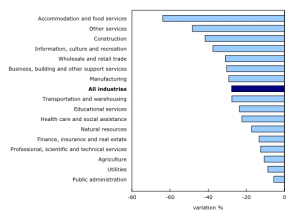
Hours worked variation (%), by industry
During the week of April 12, 12.0 million Canadians were employed and worked more than 50% of their usual hours. An estimated 5.0 million of these worked most of their hours from home. This included 3.3 million workers who usually worked at a location other than home. It can be reasonably assumed that these workers changed their workplace in response to the COVID-19 economic shutdown.
Compared with one year earlier, average hourly wages rose 10.8% in April, mainly as a result of a 7.3% increase occurring from February to April. This increase was attributable in part to larger employment declines in relatively low-paying industries, which has had the result of raising average wages.
Among students aged 15 to 24 in April, the unemployment rate increased to 31.7% (not adjusted for seasonality), signalling that many could face difficulties in continuing to pay for their studies. Among non-student youth, a little more than half were employed in April, down from three-quarters in February (data not seasonally adjusted). Employment among very recent immigrants (five years or less) fell more sharply from February to April (-23.2%) than it did for those born in Canada (-14.0%). This is partly because this group is more likely than people born in Canada to work in industries which have been particularly affected by the COVID-19 economic shutdown, such as accommodation and food services, and less likely to work in less severely-impacted industries, such as public administration.