One of NWPB’s 2020-2021 projects is to produce a gender-focused Labour Market Report. Given the current context, taking into account the gendered impacts of COVID-19 offers a deeper understanding of specific local impacts. It also offers context for those working toward gender equity and aligns with current priorities of Niagara’s Regional government. In addition to a larger report, we are publishing a series of posts outlining gender-focused labour market information.
Employment Impacts
In our previous post we provided data outlining the unequal employment impacts for men and women. This post also explored how factors such as occupation of employment may contribute to these differences. Other factors where we see unequal impacts include type of employment and labour force exits.
Full- and Part-time Work
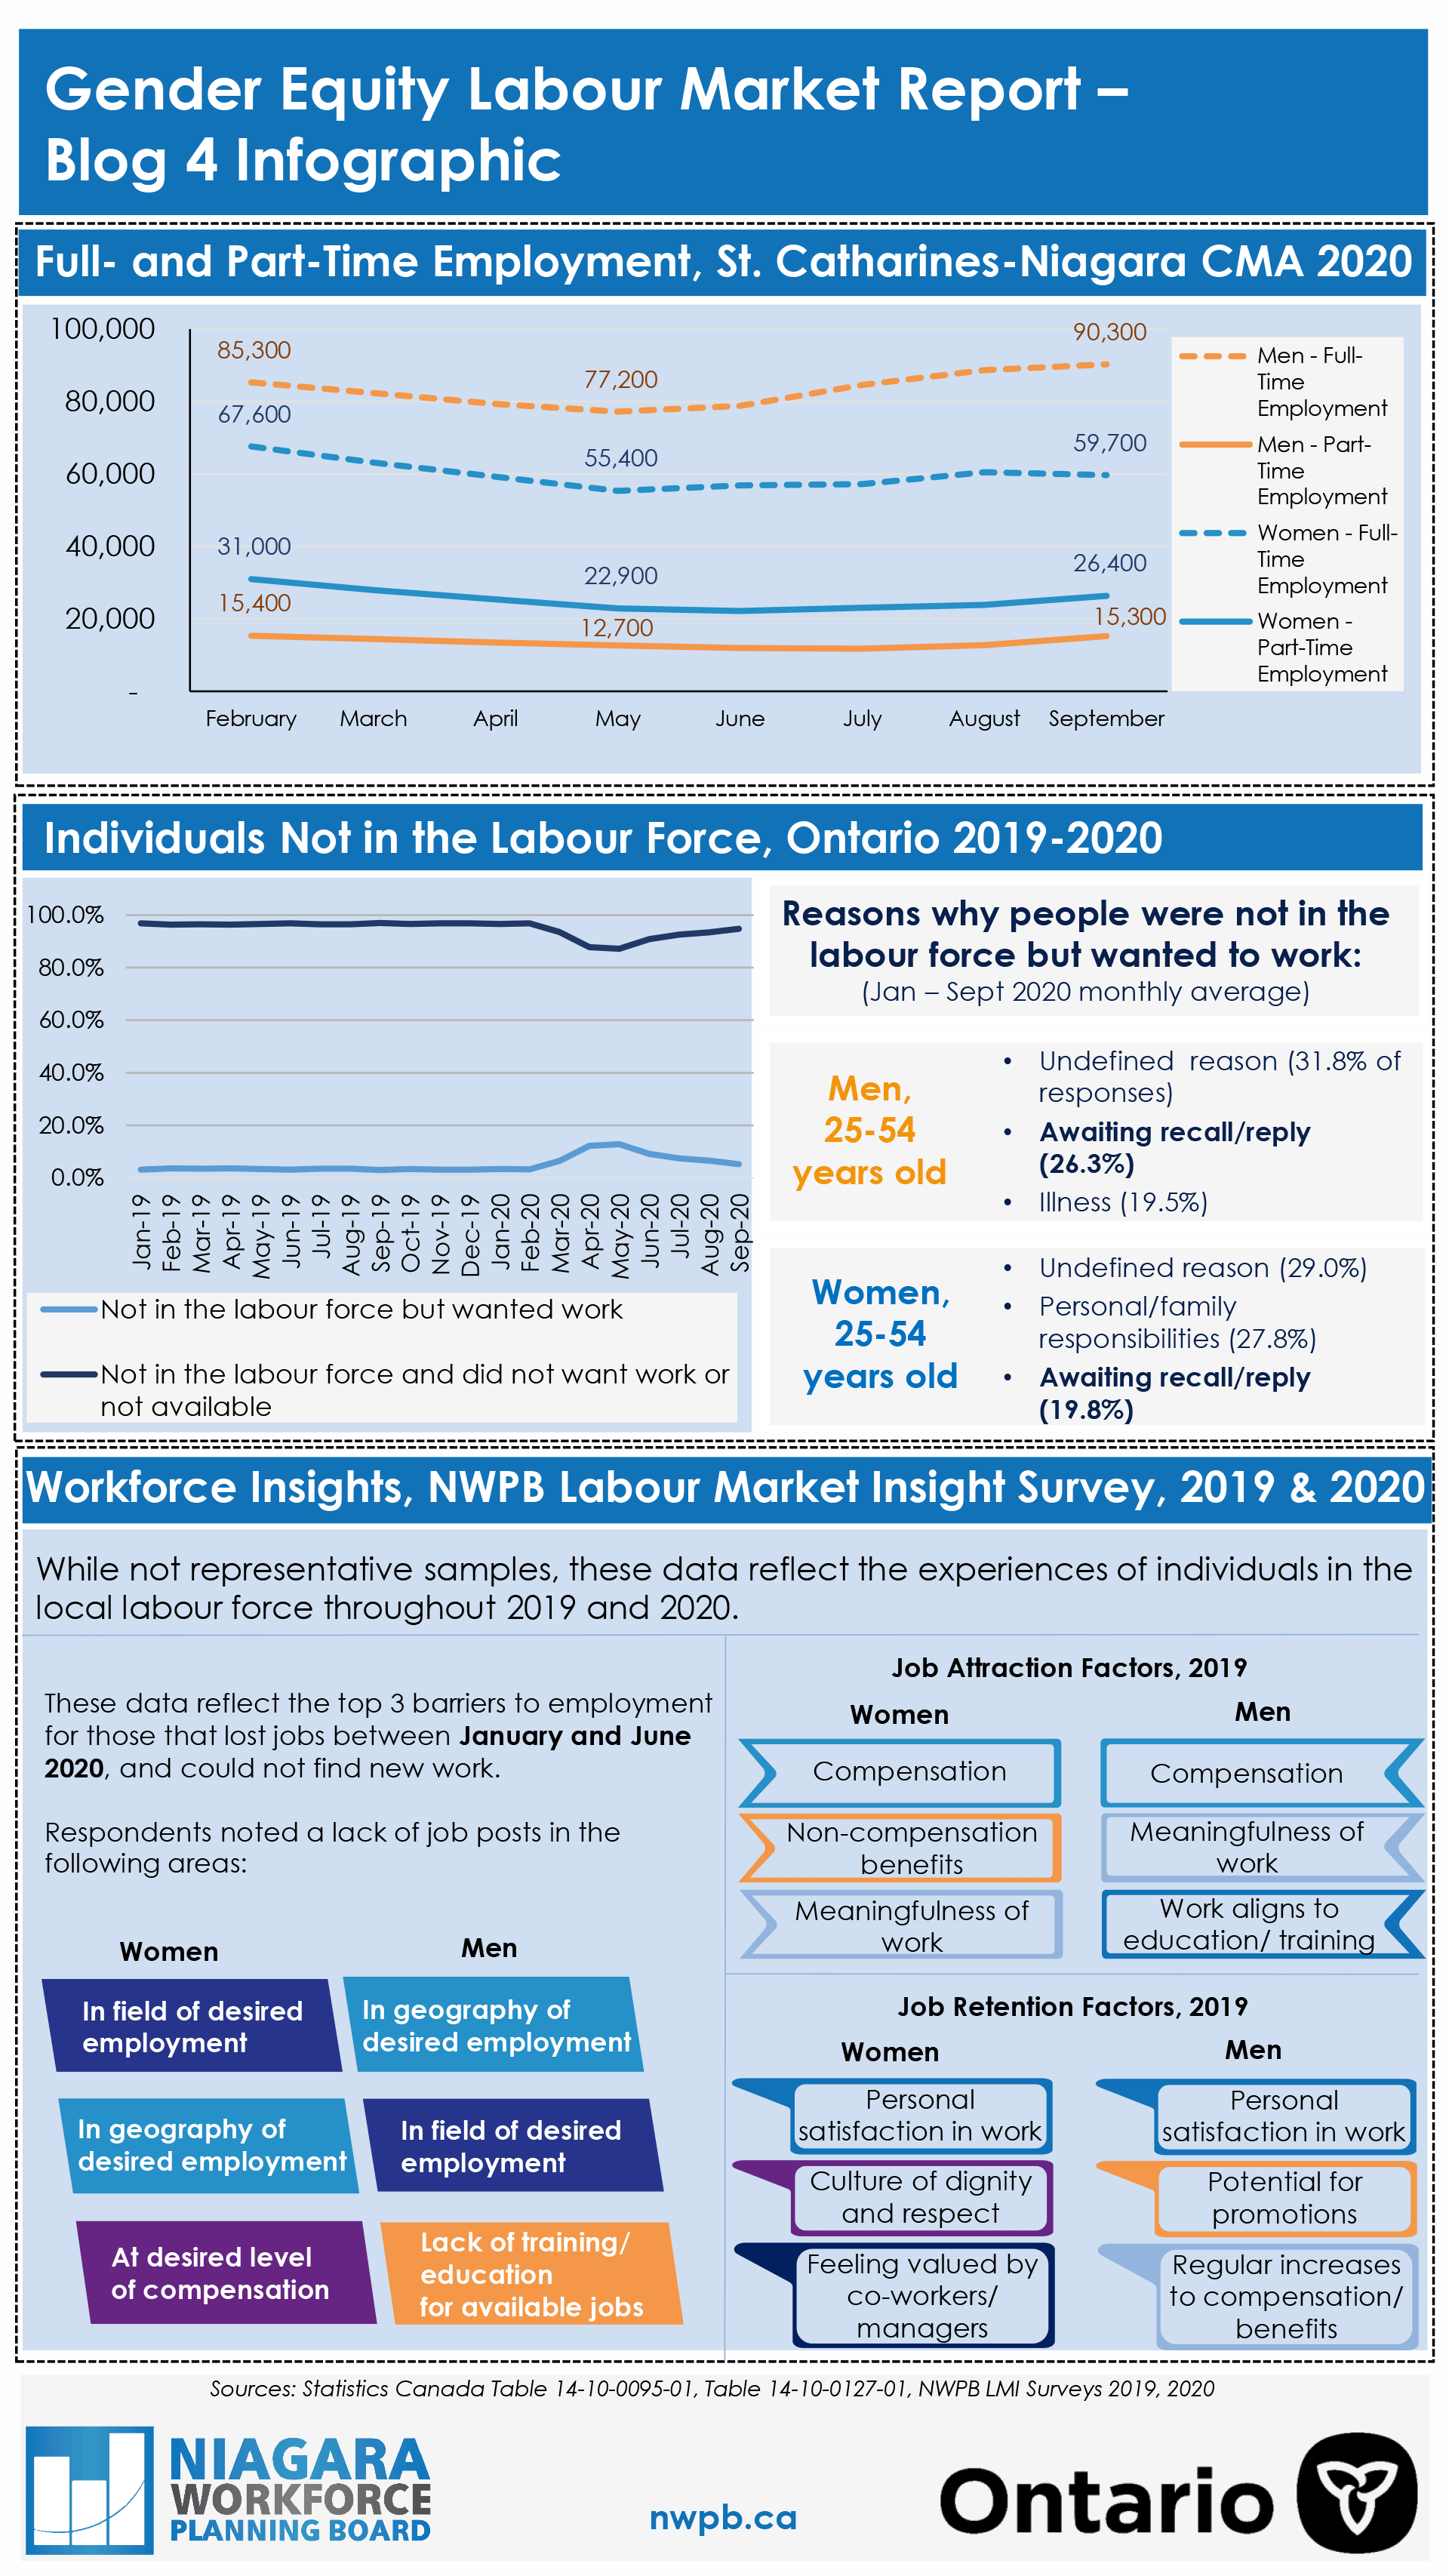
Overall, local data indicate that individuals working part-time experienced larger proportional employment decreases than individuals working full time. We also know that women tend to make up the majority of the part-time labour force.

Reasons for working part-time also tend to differ for men and women. Here we see Ontario-level data outlining the top reasons for working part-time before and during the pandemic.

Reasons for Not Being in the Labour Force
In addition to changes in employment, between February and September 2020 we saw an increase in the number of people reporting that they were not in the labour force (neither employed nor looking for work). These increases were largely concentrated in the following cohorts:
- Women aged 65+ years (increase of 8,300 individuals not in the labour force)
- Men aged 25 to 54 (increase of 900 individuals not in the labour force)
- Women aged 25 to 54 (increase of 200 individuals not in the labour force)
Provincial data show the percentage of people not in the labour force but wanting to work has, historically, been fairly low. However, 2020 saw a jump in the percentage of individuals reporting this status. The figure below also outlines the reasons people report they are not in the labour force but do want to work (note: these data are for Ontario).

Barriers to Employment
Since 2019, NWPB has conducted workforce-facing surveys to gain insights on the local labour force’s experiences (note: these data are not representative of the labour force as a whole). In 2020, we asked about the barriers experienced by individuals that had lost employment between January and June 2020, and were unsuccessful in finding new work. The top three barriers people reported were:

NWPB’s 2019 survey assessed factors that relate to employee attraction and retention. Though these are not necessarily barriers to employment, these data shed light on potential factors that may be barriers in terms of attracting and retaining employees. The top 3 factors people valued when looking for a job, or staying in a job were:

Would you like to know more? NWPB is ready for your questions. Please reach out to Vivian Kinnaird (vivian@nwpb.ca), NWPB’s CEO.


