
Ontario Small Business Support Grant now offers online status checks
To help keep businesses informed with the most up to date information, the Government of Ontario now offers a new way to check the status of an application online at https://www.app.grants.gov.on.ca/msrf/#/home#BSGStatusWindow.
Applicants will need to scroll down to the section marked “Check Ontario Small Business Support Grant application status.” To check application status, authorization number and CRA business number are required.
Starting at $10,000 for all eligible businesses, the grant provides them with funding to a maximum of $20,000 to help cover decreased revenue expected as a result of the Provincewide Shutdown. In order to qualify, business must demonstrate that they experienced a revenue decline of at least 20 per cent when comparing monthly revenue in April 2019 and April 2020.
This time period was selected because it reflects the impact of the public health measures in spring 2020, and as such provides a representation of the possible impact of these latest measures on small businesses. New businesses established since April 2019 are also eligible provided they meet the other eligibility criteria.
Over 67,000 applications have been approved to date, with more than $950 million in payments going to businesses in communities across the province.
Ontario provides $10 million to help municipalities find efficiencies
The Ontario government is providing almost $10 million to help large municipalities find better and more efficient ways to operate and save taxpayers’ dollars. This investment is being delivered through the province’s Audit and Accountability Fund and will support initiatives that focus on increasing digital services, modernization, streamlining and service integration.
Thirty-one large municipalities were approved for projects that will help them find savings in time for the 2022 municipal budget cycle. Examples include a transformation initiative in Ottawa that will examine how to streamline internal processes and a digital strategy in Thunder Bay to help the city deliver more cost-effective services.
Ontario also recently announced over $40 million under the Municipal Modernization Program to help small and rural municipalities improve the delivery of their critical local programs and services during COVID-19.
Ontario invests $150 million in transit systems
The Ontario government is providing $150 million in additional funding to help municipal transit systems address the financial impacts of the COVID-19 pandemic. This funding is in addition to the $2 billion previously committed by Ontario and the federal government through the Safe Restart Agreement to help municipalities continue to deliver critical transit services. During the peak of the pandemic, ridership dropped up to 90% of normal levels for some of Ontario’s transit systems, which resulted in significant financial impacts for municipalities.
The additional $150 million in provincial funding means that there is a total of $650 million in funding still available to municipalities up to December 31, 2021, with extensions to December 2022 granted on a case-by-case basis. In addition, Ontario is calling on the federal government to match the additional funding announced today to help ensure municipal financial needs continue to be met.
Pandemic made “extraordinary changes” in household economic well-being
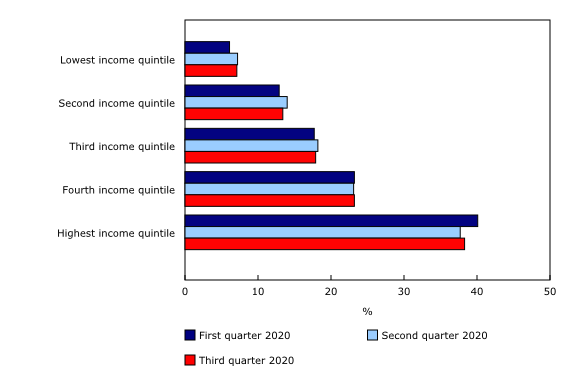
Distribution of household disposable income by income quintile, first to third quarter 2020
New experimental sub-annual distributions of household economic accounts (DHEA), released today, provide insight into how the pandemic and the associated government support measures have affected the economic well-being of different groups of households in Canada.
Over the first three quarters of 2020, disposable income for the lowest-income households increased 36.8%, more than for any other households. At the same time, the youngest households recorded the largest gain in their net worth (+9.8%). These changes were driven by unprecedented increases in transfers to households, as the value of government COVID-19 support measures exceeded losses in wages and salaries and self-employment income.
Although the everyday experiences of particular households may have differed, on average, the gap in household disposable income between the lowest- and highest-income earners declined in 2020. Households in the lowest income quintile increased their share of disposable income from 6.1% in the first quarter to a high of 7.2% in the second quarter of 2020, while those in the highest income quintile decreased their share from 40.1% to 37.7% over the same period.
Hypothetically, if the federal government had not introduced its support measures to counteract the negative impacts of the pandemic, overall household disposable income would have fallen by 3.6% in the second quarter. The largest declines would have occurred for middle- and lower-income earners, as well as younger households.
As the economy began to recover in the third quarter of 2020, relatively muted gains in disposable income occurred for higher-income earners (+5.5%) and workers aged 55 to 64 (+6.1%), while lower-income earners and younger households held onto gains achieved earlier in the second quarter.

Change in average household disposable income by income quintile, first to third quarter 2020
Although households did experience notable declines both in wages and salaries and in self-employment income in the second quarter, the value of COVID-19 support measures provided by governments more than compensated for those losses. The difference between the value of COVID-19 support measures and decreased wages and salaries and self-employment income in the second quarter was most pronounced for middle-income households, as on average they gained roughly $2,500 more than they lost. On average, young and middle-aged households gained around $3,000 more through COVID-19 support measures than they lost in wages and salaries and self-employment income in the second quarter.
While mortgage lending rates dropped to historic lows, falling to about 2% by the end of the third quarter, average mortgage debt for the lowest-income households increased 5.4% from the end of 2019, while households with a major income earner younger than 35 increased their mortgage debt by 5.8%.
Even though lower-income earners (+7.7%) and younger households (+7.9%) increased their mortgage liabilities by more than other households, they were also less leveraged as real estate values grew at an even faster pace. From the end of 2019 to the third quarter of 2020, the ratio of mortgage debt to real estate assets decreased from 32.9% to 32.2% for the lowest-income earners, and from 51.7% to 50.7% for the youngest age group.
Canada sees good news about COVID-19 inoculations as doses arrive more quickly
Canada’s COVID-19 vaccination campaign is ramping up after earlier supply disruptions and the number of inoculations last week hit a five-week high, officials said on Thursday. Canada has deals with Pfizer Inc and Moderna Inc, but both companies ran into production problems last month and reduced shipments.
The country trails many other nations in the total number of inoculations and critics accuse Prime Minister Justin Trudeau’s Liberal government of bungling the rollout. Ottawa buys the vaccines, while the 10 provinces and three northern territories administer them.
Canada says it is still on track to receive a total of 6 million doses from Pfizer and Moderna by the end of March and that anyone who wants a shot can get one by the end of September.
Reading recommendations
Why employees hesitate to speak up at work — and how to encourage them
Kyle Brykman, Jana Raver, The Conversation
Studies consistently show that employees are reluctant to speak up, and are even hardwired to remain silent, with 50 per cent of employees keeping quiet at work. Why is this the case, and how can we help people voice their opinions at work more effectively? Employee voice — speaking up with ideas, concerns, opinions or information — is vital for organizational performance and innovation. On the flip side, silence is at the root of many well-known organizational disasters.
For example, Canada’s Phoenix pay system debacle, which has already cost the federal government $1.5 billion, was attributed to a culture that “does not reward those who share negative news.” Employees who sounded alarms were told they weren’t being “team players.”
Employee voice is the antidote to this culture of silence, but it’s not easy to encourage. Employees withhold voice because they think it will not be heard or fear it may backfire by embarrassing their managers or damaging their own reputations. These reservations are reasonable.
Marketing Tips For Early-Stage Startups
Abdo Riani, Forbes
Every business needs a way to tell its customers about its products and services. Those marketing channels differ from one business to another and can change as the business grows. And just like everything else in business, marketing needs an investment. In the earliest stages of a startup, this investment is usually best spent developing a product customers need.
Imagine that you have just developed two brand new products. Product one has great signs of possible product-market fit based on customer interviews and the validation experiments data. Yet, you have no marketing budget for it. Product two is not validated at all, but you have a big marketing budget for it. Which product would you bet on?
Niagara COVID status tracker
Niagara’s most up-to-date COVID statistics, measured against the targets for the various stages of the Ontario COVID-19 Response Framework, are presented below. This does not predict government policy, but is offered to give you an idea of where Niagara is situated and how likely a relaxation (or further restrictions) may be. These data are drawn daily from Niagara Region. The Grey-Lockdown level does not have its own metrics, but is triggered when the COVID-specific measurements in a Red-Control region have continued to deteriorate.
| December 18 | December 25 | January 1 | January 8 | January 15 | January 22 | January 29 | |
|---|---|---|---|---|---|---|---|
| Reproductive number | 1.4 | 1.8 | 1.4 | 1.1 | 1.0 | 0.7 | 0.9 |
| New cases per 100,000 | 101.2 | 267.3 | 469.8 | 575.8 | 507.1 | 295.5 | 250.6 |
| New cases per day (not including outbreaks) | 60.7 | 178.7 | 311.7 | 376.9 | 325.4 | 182.7 | 145.7 |
| Percent of hospital beds occupied | 97% | 95.2% | 98.2% | 103.2% | 104.5% | 103.6% | 106% |
| Percent of intensive care beds occupied | 78.8% | 77.3% | 87.9% | 87.9% | 90.9% | 89.4% | 93.9% |
| Percentage of positive tests | 6.1% | 15.6% | 28.1% | 28.6% | 26.6% | 21.2% | 16.2% |
Definitions:
- Weekly Incidence Rate: the number of new COVID-19 cases per 100,000 people per week
- Percent Positivity: the number of positive COVID-19 tests as a percentage of all COVID-19 tests performed
- Rt: the reproductive rate, or the number of people infected by each case of the virus