
Free rapid COVID-19 testing kits are now available to businesses
Visit gncc.ca/workplace-self-screening-kits/ to learn more and reserve kits for your organization.
Ontario accelerating second-shot rollout
Ontario is preparing to roll out the eligibility for accelerated second dose appointments starting with individuals aged 80 and over, beginning on May 31, 2021. If there is sufficient vaccine supply, it is anticipated that the majority of Ontario residents who choose to receive the vaccine will be able to be fully vaccinated by the end of summer.
The following is an anticipated schedule for eligibility to book a second dose appointment based on confirmed supply.
- Week of May 31: individuals aged 80+
- Week of June 14: individuals aged 70+
- Week of June 28: individuals who received their first dose between the week of March 8 to April 18, on a “first-in, first-out” basis. For example, this included individuals with the highest-risk health conditions and special education workers.
- Week of July 19: individuals who received their first dose between the week of April 19 to May 9, on a “first-in, first-out” basis. For example, this included individuals aged 50 and over, as well as individuals with high-risk health conditions.
- Week of August 2: individuals who received their first dose between the week of May 10 to May 30, on a “first-in, first-out” basis. For example, this included individuals who cannot work from home and individuals who have at-risk health conditions.
- Week of August 9 to 16: individuals aged 12 to 25
- Week of August 9: individuals who received their first dose from the week of May 31 onwards on a “first-in, first out” basis, respecting the recommended intervals.
David Oakes selected as new City of St. Catharines Chief Administrative Officer
David Oakes has been selected by City Council to serve as the next Chief Administrative Officer for the City of St. Catharines.
With the announcement of the retirement of current CAO Shelley Chemnitz, Council embarked on a recruitment process to select a new CAO, ultimately selecting Oakes to fill the role. Chemnitz leaves the position after over 30 years with the municipality. Oakes will officially transition into the CAO position on Aug. 1, 2021, leaving his current role as Deputy CAO, a position he has filled since 2018.
Economic activity still 2% lower than pre-pandemic, one-third of all businesses expect declining profitability
Real gross domestic product grew 0.4% in February, after having grown 0.7% in January, the latest results of the Canadian Survey on Business Conditions show. This 10th consecutive monthly increase continued to offset the steepest drops in Canadian economic activity on record in March and April 2020. However, total economic activity was about 2% below the level observed in February 2020, before the COVID-19 pandemic.
Over the next three months, one-third of businesses expected their profitability to decrease, one-quarter expected their sales to decrease, one-fifth expected to increase the prices they charge and three-quarters expected their number of employees to remain the same. Businesses were concerned with future survival and expected to face a variety of obstacles in the short term.
Over one-third (37.1%) of all businesses and over half (51.6%) of businesses in accommodation and food services expected their profitability to decrease over the next three months. Conversely, 12.4% of businesses expected their profitability to increase, most notably, those in wholesale trade (19.4%), manufacturing (18.0%) and retail trade (17.0%). Just over one-quarter (25.7%) of businesses expected their sales to decrease over the next three months, down from nearly one-third of businesses last quarter. Businesses in accommodation and food services (42.1%) were most likely to expect sales to fall.
Over two-thirds (68.5%) of businesses reported they could continue to operate at their current level of revenue and expenditures for 12 months or more before considering closure or bankruptcy. Similar to last quarter, almost 1 in 10 (9.5%) businesses reported they could continue for less than 12 months. Under one-quarter of businesses in accommodation and food services (22.8%) reported they could continue to operate at their current level of revenue and expenditures for less than 12 months before having to consider closure or bankruptcy, down from 24.9% of businesses last quarter.
The Canadian Chamber of Commerce stated that Canada’s rate of business investment has consistently been among the lowest in the OECD. The ability of businesses to use debt to spur investment seems increasingly tenuous.
Niagara Workforce Planning Board said that the data illustrate how the pandemic is having multiple impacts in Niagara. Employment in accommodation and food services, for example, was down 15% in April 2021 compared to the already historic employment lows created by the pandemic in April 2020. With the CSBC reporting expectations of reduced profitability in that sector, it is reasonable to assume this will have a negative impact on Niagara’s displaced workers as they attempt to return to work in this sector. At the same time, employment in manufacturing could be seen to move from strength to strength based on the CSBC’s trends. In April of 2021, local employment in manufacturing was up 41.2% compared to April 2020. Reports of profitability increases in this sector, combined with on-going demand for skilled trades people in Niagara, will likely offer a source of stable employment for individuals looking for work.
Household income higher in 2020 than 2019
Despite declines in disposable income in the fourth quarter, all households recorded higher income in 2020 compared with 2019, Statistics Canada has reported. Lower- and middle-income earners recorded the largest annual increases in disposable income, as government COVID-19 support measures outpaced losses in compensation of employees and self-employment mixed income. As a result, the gap between the lowest- and highest-income households, calculated as the difference between their respective shares of total disposable income, shrank 1.9 percentage points in 2020 compared with 2019.
Disposable income declined for most households in the fourth quarter of 2020, with the largest losses for the lowest-income earners (-10.2%). Despite declines at the end of the year, lower- and middle-income households recorded the largest increases in disposable income, rising by 13.0% to 17.6% in 2020 compared with 2019. The overall gains were led by unprecedented increases in current transfers in the second quarter, as governments’ COVID-19 support measures were implemented to help mitigate negative impacts from the pandemic.
Canada Child Benefit claimants to receive additional funding for young children
The Prime Minister, Justin Trudeau, today announced that families entitled to the CCB will receive additional support of up to $1,200 for each child under the age of six. Families with a net income of $120,000 or less will receive up to four tax-free payments of $300. Families with a net income above $120,000 will receive up to four tax-free payments of $150, for a total benefit of up to $600.
The first and second payments will be issued today, with subsequent payments on July 30 and October 29, 2021.
To ensure that more money goes to the families that need it the most, families with net incomes that are too high to be entitled to the CCB will not receive these additional payments.
Reading Recommendations
Canada is ‘well and truly over the peak of the 3rd wave,’ Dr. Tam says
CBC News
Canada’s chief public health officer said today that strict public health measures and a ramped-up vaccination campaign have pushed the national COVID-19 case count to its lowest level in weeks. In much of the country, the pandemic outlook is improving.
Dr. Theresa Tam said the distribution of some 25 million vaccine doses has resulted in a “strong and steady decline” in cases, with totals less than half what they were during the peak of the third wave in mid-April.
Meet Your Next Angel Investor. They’re 19
Wired
Historically, angel investing has been off the table for young people, because of wealth requirements set by the Security and Exchange Commission. Anyone can buy stock in a public company, but investments in private companies are riskier and more speculative, which has led to tighter regulations from the SEC. Since the 1930s, only people with an income greater than $200,000, or at least $1 million in net worth, could make angel investments—which excludes most Americans, and certainly most young people, from taking part.
Two regulatory changes have made investing more accessible: In 2016, the SEC created new rules allowing startups to raise more money through equity crowdfunding, taking smaller checks from people who don’t meet the definition of an accredited investor. And last year, it separately loosened its requirement for accredited investors, allowing for people with an “understanding of private markets” to become angels. Now, people who work for private funds or who have passed a licensing exam to demonstrate their “financial sophistication” can take part, even if they don’t meet the SEC’s wealth requirements. And those who don’t can still funnel money into a special-purpose vehicle, where a lead investor represents a group of individuals and combines their investments into one syndicate.
Featured Content
![]()
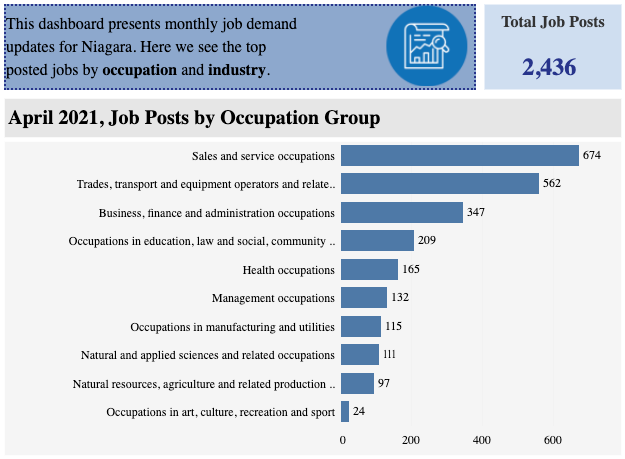
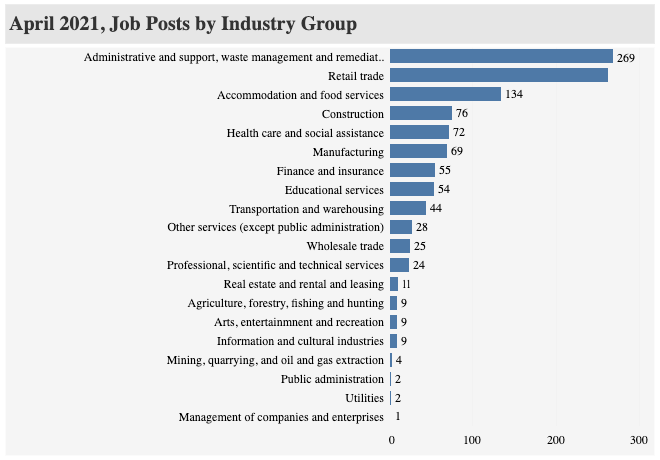
Sector Specific Job Demand Introduction
 |
 |
View the Dashboard |
|
Over the past year, we have seen the pandemic significantly impact local employment – an effect felt by both employers and job seekers. These impacts demonstrate the need for current insights on the jobs that are in demand despite the pandemic. With this in mind, NWPB’s Sector Specific Job Demand project sheds light on Niagara’s in-demand jobs, the skills employers prioritize in their job postings, and the level of education typically required for advertised jobs.
Our goal is that these resources support employers by promoting their needs while also offering direction and insights for people looking to find work.
NWPB will provide updates on a monthly basis through an interactive dashboard currently available here. We also will be providing quarterly updates outlining local hiring trends, sector-specific insights, and occupational profiles for jobs most in demand.
In addition to these resources, NWPB has a variety of job search tools which are available at our website, www.nwpb.ca
Niagara COVID status tracker (May 22)
Niagara’s most up-to-date COVID statistics, measured against the targets for the various stages of the Ontario COVID-19 Response Framework, are presented below. This does not predict government policy, but is offered to give you an idea of where Niagara is situated and how likely a relaxation (or further restrictions) may be. These data are the most recent published by Niagara Region. The Grey-Lockdown level does not have its own metrics, but is triggered when the COVID-specific measurements in a Red-Control region have continued to deteriorate.
The Province of Ontario is currently under a stay-at-home order. The COVID-19 Response Framework does not apply during this order. Click here to review the restrictions currently in place.
▲: Metric has increased since last published measurement
▼: Metric has decreased since last published measurement
— : Metric has not changed since last published measurement
| December 18 | December 25 | January 1 | January 8 | January 15 | January 22 | January 29 | |
|---|---|---|---|---|---|---|---|
| Reproductive number | 1.4 | 1.8 | 1.4 | 1.1 | 1.0 | 0.7 | 0.9 |
| New cases per 100,000 | 101.2 | 267.3 | 469.8 | 575.8 | 507.1 | 295.5 | 250.6 |
| New cases per day (not including outbreaks) | 60.7 | 178.7 | 311.7 | 376.9 | 325.4 | 182.7 | 145.7 |
| Percent of hospital beds occupied | 97% | 95.2% | 98.2% | 103.2% | 104.5% | 103.6% | 106% |
| Percent of intensive care beds occupied | 78.8% | 77.3% | 87.9% | 87.9% | 90.9% | 89.4% | 93.9% |
| Percentage of positive tests | 6.1% | 15.6% | 28.1% | 28.6% | 26.6% | 21.2% | 16.2% |
Definitions:
- Weekly Incidence Rate: the number of new COVID-19 cases per 100,000 people per week
- Percent Positivity: the number of positive COVID-19 tests as a percentage of all COVID-19 tests performed
- Rt: the reproductive rate, or the number of people infected by each case of the virus
Niagara COVID vaccination tracker (May 28)
Niagara’s most up-to-date vaccination numbers are presented below, along with comparison data from Ontario, Canada, and G7 countries.
Total doses administered in Niagara: 274,200
Total doses administered in Niagara since yesterday: 4,538
| Percentage of population with one dose | Percentage of population fully vaccinated | |
|---|---|---|
| Niagara | 82.7% | 78.2% |
| Ontario | 84.6% | 79.1% |
| Canada | 84.7% | 78.6% |
| United States | 75% | 64% |
| United Kingdom | 78% | 72% |
| Germany | 76% | 74% |
| France | 80% | 77% |
| Italy | 83% | 76% |
| Japan | 80% | 79% |
| World | 63% | 53% |
Data are drawn from Niagara Region, the Government of Ontario, and Oxford University’s Our World in Data project. Please note that these data include people of all ages; other reports on e.g. adults over 18 will have different figures.